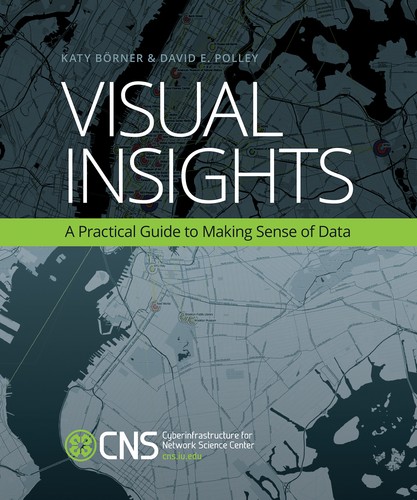
Visual Insights
- Pages
- 312
- 5 editions
- First published
- 2014
- 1 language
Join or log in to shelve and rate Free, no password.
Overview
"In 2010, Börner published Atlas of Science: Visualizing what We Know with us, and the work found an audience across a wide range of readers. Although Katy is busy working on the second Atlas volume, she has taken her info viz talents to the street via an Indiana University MOOC. This course applies advanced data mining and visualization techniques to communicate temporal, geospatial, topical, and network data of IVMOOC13 teaching and learning, provides instructions on how to collaborate with external clients and presents the best 2013 project results, closes with an outlook on MOOC trends and opportunities. This book is for this course. The work is the core of her information visualization course and is intended to serve as a stand-alone resource and how-to guide for those seeking to learn the tricks of information visualization. Part "how-to" book and part primer in data and information across the disciplines, Börner's work provides the perfect text for beginner mastery of the topic"--
Ratings & reviews
Log in to rate or review this book.
No written reviews yet.
Discussions
Talk about this book with other readers.
Log in to start a discussion.
No discussions yet.
Editions

Details & links
- First published
- 2014
- Pages
- 312
- Languages
- Available in 1 language
Where to buy this book: see “Buy this book”
More about this book
Read a sample, borrow it or see other editions → openlibrary.org